Technical Guide
Radiance: A Raymarching Benchmark
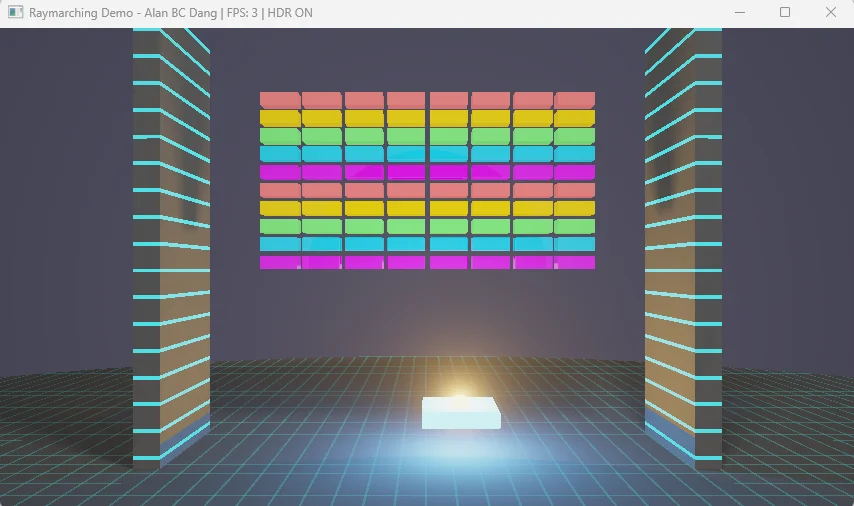
A GPU compute benchmark that renders classic Breakout through pure mathematics — no triangles, no textures, no shortcuts.
For gamers who want to stress-test their PC
A GPU compute benchmark that renders classic Breakout through pure mathematics — no triangles, no textures, no shortcuts.
Download
Full visual fidelity via WebGPU and WebAssembly — the same raymarched Breakout, running directly in your browser. Performance is significantly slower than native builds due to browser overhead, but the visuals are identical.
Warning: May crash mobile devices including iPhones — this benchmark demands serious GPU compute even from desktops.
Native Builds
The Windows benchmark is currently being detected as having malware. This should be a false positive. My source code is clean and has been sent to Microsoft (Jan 13,2026).
Shorter, repeatable runs for extreme overclockers comparing hardware under LN2. More susceptible to driver-level optimization than the randomized standard build.
Why two Windows builds? Both v1.0 and v1.1 were flagged as malware by AI-powered security vendors — a false positive. Both remain listed with SHA256 hashes to document that the original binaries were always clean. The v1.1 deterministic build serves a different purpose: shorter, fixed-seed runs for extreme overclockers comparing hardware under liquid nitrogen cooling. For the full story on AI-powered malware detection and the asymmetry between flagging threats and clearing false positives, see From Artificial Intelligence to Artificial Wisdom.
Linux & macOS Results Require Manual Verification: The outlier detection algorithm was developed and validated against DirectX 12 frame timing behavior on Windows. Linux and macOS builds exhibit higher frame time variance, and the current detection heuristics may allow more anomalous samples to pass through unfiltered. Review your benchmark reports carefully and re-run if results appear inconsistent. See Cross-Platform Testing →
macOS Gatekeeper Notice: Because this app is self-signed rather than notarized through Apple, macOS may display a warning that the app "cannot be opened" or is "damaged."
Option 1 — System Settings:
1. Open System Settings → Privacy & Security
2. Scroll to Security and click Open Anyway (appears within ~1 hour of attempting to launch)
3. Enter your login password when prompted
Option 2 — Terminal:
xattr -cr /Applications/Radiance.app
The Prophecy — Fulfilled
"The future of graphics is software rendering...
Eventually, the flexibility of programmable approaches will outweigh the speed advantages of fixed-function hardware."
Tim Sweeney, Founder of Epic Games
Sweeney was right. He understood that the future belonged to programmable approaches — arbitrary, flexible computation that could evolve beyond fixed-function limitations. What he couldn't have predicted was which silicon would realize that vision.
The answer turned out to be graphics processors — but not as graphics processors. Today's "GPUs" are massively parallel math engines that happen to retain their legacy name. They run AI inference, scientific simulations, cryptographic calculations, and yes, graphics. The "G" is historical artifact; these are general-purpose parallel processors that can be programmed to do anything.
This benchmark embodies Sweeney's vision: software rendering executed on programmable hardware. No fixed-function rasterizer. No triangle pipeline. Just mathematical functions evaluated billions of times per second by silicon designed for exactly this kind of flexible, arbitrary computation. Twenty-five years later, we're living in the future he described.
Original Interview (Archive.org)
https://web.archive.org/web/19991127184238/http://www.gamespy.com/interviews/sweeney_b.shtm Read the entire 1999 Interview →01 — Origin
This benchmark started as a weekend project to recreate Breakout — the 1976 Atari game — with modern graphics. The twist: instead of traditional rendering, every pixel is calculated through pure mathematics. No shortcuts.
Something unexpected happened: the "simple" game brought an RTX 5090 to its knees. A geometrically trivial game from 1976, rendered with modern techniques, genuinely stresses cutting-edge hardware.
The default configuration uses just ~5KB of data (80 bricks + 80 debris particles). Even the Extreme preset with 640 debris tops out at ~32KB — the entire scene fits in your GPU's L1 cache!
This benchmark evolved from a 32KB WebGPU implementation into a DirectX 12 compute shader benchmark. The original plan was straightforward: take 80 bricks, a paddle, and a ball, then render them with physically accurate lighting, real-time soft shadows, and full raymarched geometry. No texture maps, no pre-baked illumination, no shortcuts — just pure mathematics calculating every pixel from first principles.
The computational payload is remarkably small. The default configuration (80 debris) uses approximately 5KB:
The Extreme configuration (640 debris) increases debris storage to 30,720 bytes, bringing the total working set to approximately 32KB. Even at maximum complexity, the entire scene fits comfortably in L1 cache on modern GPUs.
This benchmark tests computational throughput and execution efficiency, not VRAM memory bandwidth. The GPU spends time computing distance fields rather than waiting for memory fetches.
Note: For applications that stream gigabytes of textures or process massive datasets, memory bandwidth becomes critical. AI inference benchmarks or professional rendering applications with large texture sets are better suited for testing memory subsystem performance.
02 — Controls
All benchmark settings are accessible through the Mission Control panel window. You can also use keyboard shortcuts, but the panel provides the easiest way to configure and run the benchmark.
Click "Launch Benchmark" to open the configuration dialog. Quick presets include "RTX 5090" (720p, 80 debris) for current flagship GPUs and "Extreme" (1080p, 640 debris) for stress testing.
480p (default), 720p, 1080p, 2.5K, or 4K. Higher resolutions stress the GPU more; 480p is the baseline for comparable scores.
No debris, 80 (default), 320, or 640 particles. More debris = more computation per pixel. The 80-debris default provides meaningful load while remaining playable.
Off (default), On, or Triple Buffer. VSync Off enables uncapped FPS for accurate benchmarking. Enable VSync for tear-free gameplay outside benchmarks.
Enable AI paddle control for hands-free benchmarking. The AI intercepts most balls automatically.
Sliders for brightness, ball glow, and ray steps (1–1024). Level selection buttons let you test all 6 included levels. These settings affect visual quality and computational load.
The Mission Control panel provides GUI access to all benchmark parameters. Every keyboard shortcut has an equivalent control here.
"Launch Benchmark" opens the configuration dialog with resolution, debris, VSync, and run mode options. Quick presets: "RTX 5090" (720p, 80 debris) for flagship GPUs, "Extreme" (1080p, 640 debris) for stress testing. Single-run (40s) or multi-run (4×40s) modes available.
480p (default), 720p, 1080p, 2.5K (2560×1440), 4K (3840×2160). Thread dispatch scales quadratically: 4K dispatches 8.3M threads vs 480p's 0.3M threads. Future hardware may warrant higher resolutions.
No debris, 80 (default), 320, or 640 particles. Each particle adds distance calculations to every raymarching step. The debris loop is the primary performance scaling factor.
Off (default): Uncapped FPS for accurate benchmarking. Maps to VK_PRESENT_MODE_IMMEDIATE_KHR (Vulkan) or Present(0, DXGI_PRESENT_ALLOW_TEARING) (DX12).
On: Caps to monitor refresh rate. Uses FIFO mode.
Triple Buffer: Reduced tearing with less latency than FIFO. Uses MAILBOX mode.
Enables deterministic AI paddle control. Algorithm: find lowest descending ball, move paddle toward ball.x at 20% of position difference per frame. CPU overhead <0.1%.
The autoplay AI is intentionally simplistic but effective for benchmark reproducibility:
Every frame:
1. Find the lowest active ball with negative y-velocity (descending)
2. Calculate that ball's horizontal position (ball.x)
3. Move paddle toward that position at 20% of the difference
This creates smooth, natural-looking movement that intercepts most balls. The AI doesn't look ahead, so fast-moving balls at steep angles can sometimes escape. The algorithm runs on the CPU with negligible overhead.
Brightness: Global light intensity multiplier (affects shadow visibility)
Ball Glow: Emissive intensity of ball light sources (affects colored lighting on surfaces)
Ray Steps: Maximum raymarching iterations per primary ray (1–1024). Default 72 for benchmarking; 1024 for maximum precision
Level Selection: 6 levels with different brick arrangements, each providing varied complexity curves during destruction
03 — Architecture
Traditional games draw triangles. This benchmark doesn't use triangles at all — it calculates everything mathematically.
For each pixel on your screen, the GPU shoots a virtual "ray" into the scene. Instead of checking if that ray hits a triangle, the benchmark uses mathematical equations to determine the distance to every object. It "marches" the ray forward step by step until it finds a surface.
Sphere Tracing (Raymarching) Visualization
This technique is called sphere tracing. At each step, the math tells us "the nearest surface is at least X units away," so we can safely jump forward by that distance. Repeat until we hit something or escape into empty space.
A signed distance field (SDF) is a mathematical function that takes a point in 3D space and returns the distance to the nearest surface. For a sphere centered at position C with radius R:
distance = length(point - center) - radius
If the result is negative, you're inside the sphere. If positive, you're outside, and the magnitude tells you exactly how far away the surface is. The power of SDFs comes from combining them — the scene SDF evaluates every object and returns the minimum distance.
Sphere Tracing Algorithm
At 4K resolution (3840×2160), this dispatches 8,294,400 threads organized in 8×8 tiles. Each thread calculates one pixel by marching rays up to 72 steps (benchmark default) or 1,024 at maximum quality.
04 — Stress Points
This benchmark pushes your GPU's math processing power to the limit. Unlike most games that spend time moving textures around, Radiance keeps your GPU busy with pure calculations.
Sustained floating-point math: square roots, dot products, and distance calculations — thousands per pixel.
Adjacent pixels can take completely different paths through the code, testing your GPU's ability to handle varied workloads.
Important: This benchmark generates significant heat. Ensure your cooling is adequate and that all power cables (especially 12VHPWR) are properly seated.
Sustained floating-point arithmetic: square root operations (vector length), dot products (lighting), absolute values and component-wise operations (box SDF), min/max operations (combining SDFs). Compute units stay saturated.
Adjacent pixels can take wildly different execution paths. Pixel (0,0) might hit a brick after 5 march steps. Pixel (0,1) might march 150 steps finding nothing. Yet these threads execute in the same SIMD group (warp/wavefront). Architectures with better divergence handling show measurable advantages.
Procedural shader code with multiple material types and lighting paths creates a larger instruction footprint than simple benchmarks with tiny loops. The I-cache must hold the entire shader and prefetch efficiently as execution branches.
Each thread maintains ray position (3 floats), direction (3 floats), accumulated color (3 floats), scene evaluation results (4 floats), and temporaries. This creates register pressure limiting simultaneous in-flight threads. GPUs with larger register files maintain higher occupancy.
A single pixel at default settings (72 ray steps, 80 debris) might trace:
Each evaluation loops through 80 bricks and the active debris count (80 default, up to 640 in Extreme mode). At default: 72 steps × 80 debris = 5,760 distance calculations per pixel for primary ray alone. At Extreme (128 steps × 640 debris): 46,080+ evaluations per pixel. Multiply by 8.3 million pixels at 4K.
Fixed-function triangle-ray intersection units. SDFs are mathematical functions, not triangles — RT Cores cannot evaluate arbitrary equations.
Matrix multiplication accelerators for FP16/INT8. This benchmark performs scalar floating-point arithmetic on individual values and small vectors. No matrix operations.
Vertex shaders, hull/domain/geometry shaders, rasterizer, and output merger all sit idle. Provides zero information about their performance.
Historical Parallel: RT Cores mirror the early 2000s transition from fixed-function T&L to programmable shaders. The GeForce 256's hardware T&L was faster for specific operations, but programmable shaders enabled techniques fixed-function hardware couldn't support. RT Cores are specialized hardware for common operations that cannot handle workloads outside their designed scope.
05 — The Code
The entire rendering engine fits in approximately 400 lines of HLSL across two compute kernels. Complete source is provided with the benchmark.
The benchmark defines surfaces using mathematical equations. For a sphere, it's the distance from any point to the center, minus the radius. For a box, it uses the maximum of each axis component.
sdBox() — Calculates distance to a rectangular solid (bricks, paddle, walls)
length(p - center) - radius — Distance to a sphere (balls)
The scene SDF evaluates all objects and returns the minimum — "the nearest surface is this far away."
HLSL Source
float sdBox(float3 p, float3 b) {
    float3 q = abs(p) - b;
    return length(max(q, 0.0))
         + min(max(q.x, max(q.y, q.z)), 0.0);
}

// Ball distance (inline)
float dBall = length(p - ballPos.xyz) - 0.7;

// Scene combines all objects
float4 mapScene(float3 p) {
    float res = mapOpaque(p, true, false, ...);
    // Check each ball
    [unroll]
    for (uint i = 0; i < MAX_BALLS; ++i) {
        if (state.ballPos[i].z > 0.0) {
            float dBall = length(p - state.ballPos[i].xyz) - 0.7;
            if (dBall < res) {
                res = dBall;
                closestMat = 2.0; // Ball material
            }
        }
    }
    return float4(res, closestMat, auxY, auxZ);
}
Line-by-Line Explanation
// Box SDF using standard formula
// q = signed distance on each axis
// For points outside: Euclidean distance to corner
// For points inside: negative of penetration depth


// Sphere is simple: distance to center minus radius
// Negative = inside, Positive = outside

// Scene SDF returns minimum distance across all objects
// This is the fundamental SDF combination operator

// [unroll] hint: compiler unrolls loop for performance
// MAX_BALLS = 12 (compile-time constant)

// ballPos[i].z > 0 means ball is active
// (w component often used for active flag)

// Ball radius is 0.7 units

// Track which material is closest for shading
// Material 2 = emissive ball surface


// Return: (distance, material, aux1, aux2)
// aux values carry material-specific data
Each pixel fires a ray from the camera. The ray steps forward repeatedly, asking "how far to the nearest surface?" each time. When that distance drops below 0.001 units, we've hit something.
72 steps — Benchmark default iterations per ray
1,024 steps — Maximum quality setting
More steps = more accurate surfaces, but exponentially more computation.
HLSL Source
[numthreads(8, 8, 1)]
void renderCS(uint3 id : SV_DispatchThreadID) {
    uint2 dims;
    outputTex.GetDimensions(dims.x, dims.y);
    if (id.x >= dims.x || id.y >= dims.y) return;

    float2 uv = (float2(id.xy) - float2(dims) * 0.5)
                / (float)dims.y;

    float3 ro = float3(0.0, 0.0, 48.0);  // Camera
    float3 rd = normalize(float3(uv.x, -uv.y, -1.2));

    float t = 0.0;
    bool hit = false;
    int limit = (int)state.maxRaySteps;

    [loop]
    for (int i = 0; i < limit; ++i) {
        float4 res = mapScene(ro + rd * t);
        if (res.x < 0.001) {
            hit = true;
            mData = res;
            break;
        }
        t += res.x;  // Step by safe distance
        if (t > 100.0) break;  // Escaped
    }
    // ... lighting calculations follow
}
Line-by-Line Explanation
// 8×8 = 64 threads per group (vendor-neutral)
// Divides evenly by 16, 32, 64 for all architectures

// Get output texture dimensions dynamically
// Bounds check: threads outside texture do nothing


// UV coordinates normalized to [-0.5, 0.5]
// Aspect ratio preserved (divide by height only)

// Camera positioned at z=48, looking toward origin
// -1.2 z-component sets ~80° field of view

// t = total distance traveled along ray
// limit = 72 benchmark default, 1024 max quality

// [loop] hint: don't unroll (variable iteration count)

// mapScene returns (distance, material, aux, aux)
// 0.001 = hit threshold (surface found)
// Store material data for shading


// Sphere tracing: step by SDF distance (safe)
// 100.0 = max ray distance (escaped scene)

// If hit: calculate normals, shadows, lighting
When a ray hits a surface, the shader traces additional rays toward each light source. These "shadow rays" determine how much light reaches that point.
1 global light ray — Main scene illumination
Up to 4 ball light rays — Each glowing ball casts colored light
Objects that almost block the light create partial shadows, giving the soft, realistic penumbras you see in the benchmark.
HLSL Source
float2 softShadowSteps(
    float3 ro, float3 rd,
    float k, float maxDist,
    float noise,
    bool includePaddle,
    bool isBallShadow
) {
    float res = 1.0;
    float t = 0.05 + (noise * 0.02);
    float steps = 0.0;

    [loop]
    for (uint i = 0; i < 160; ++i) {
        steps += 1.0;
        float h = mapOpaque(ro + rd * t, ...);
        res = min(res, k * h / t);
        t += clamp(h, 0.02, 0.5);
        if (res < 0.001 || t > maxDist)
            break;
    }
    return float2(clamp(res, 0.0, 1.0), steps);
}
Line-by-Line Explanation
// Returns (shadow factor, step count)
// ro = shadow ray origin (surface + normal offset)
// rd = direction toward light source
// k = penumbra softness (8.0 = soft shadows)
// maxDist = distance to light
// noise = per-pixel jitter to reduce banding
// includePaddle = whether paddle casts shadows
// isBallShadow = special handling near balls

// res = 1.0 means fully lit
// Start slightly offset to avoid self-intersection
// Track steps for performance analysis

// Up to 160 steps per shadow ray

// Evaluate scene SDF at current position
// Soft shadow formula: smaller h/t = darker shadow
// Near-misses create penumbra effect
// Clamp step size for stability
// res < 0.001 = fully shadowed, early exit
// t > maxDist = reached light, done

// Return shadow factor [0,1] and diagnostic steps
The physics kernel simulates debris particles using explicit Euler integration — the same method used in professional finite element analysis codes like LS-DYNA.
640 particles max — 80 bricks × 8 debris per brick
Each particle has position, velocity, rotation, and color. Collisions with walls, floor, and paddle are handled with restitution coefficients.
HLSL Source
[numthreads(64, 1, 1)]
void updatePhysics(uint3 id : SV_DispatchThreadID) {
    uint idx = id.x;
    if (idx >= (uint)state.debrisCount) return;

    Particle p = debris[idx];
    if (p.pos.w < 0.5) return;  // Inactive

    // Explicit Euler integration
    p.vel.y -= 0.015;  // Gravity
    p.pos.x += p.vel.x;
    p.pos.y += p.vel.y;
    p.pos.z += p.vel.z;
    p.color.a += p.vel.w;  // Rotation
    p.vel *= 0.98;  // Drag

    // Wall collisions (restitution 0.6)
    if (p.pos.x > 19.5) {
        p.pos.x = 19.5;
        p.vel.x *= -0.6;
    }
    // ... similar for other walls

    // Floor collision (restitution 0.4)
    if (p.pos.y < -14.5) {
        p.pos.y = -14.5;
        p.vel.y = -p.vel.y * 0.4;
        p.vel.x *= 0.8;  // Friction
    }

    debris[idx] = p;
}
Line-by-Line Explanation
// 64 threads: matches all vendor SIMD widths
// One thread per particle

// Early exit if beyond active particle count

// Read particle from structured buffer
// pos.w = active flag (1.0 = active)

// Standard explicit Euler integration
// Same method as LS-DYNA, ABAQUS Explicit
// new_pos = old_pos + velocity * dt
// (dt = 1.0 implicit in coefficients)

// vel.w = angular velocity for visual spin
// Linear drag coefficient

// Walls at x = ±19.5
// Coefficient of restitution: 0.6
// Particle loses 40% energy on bounce


// Floor at y = -14.5
// More inelastic than walls (0.4)
// Additional friction on horizontal velocity
// Simulates rough surface contact

// Write back to UAV buffer
06 — Industry Relevance
Lumen's software ray tracing mode uses signed distance fields generated from triangle meshes. The global illumination system shoots rays through these distance fields using compute shaders — the same computational pattern this benchmark uses.
| Parameter | UE5 Lumen (60 FPS target) | Radiance (Full Quality) |
|---|---|---|
| Primary rays per pixel | 1–2 | 1 |
| Steps per ray | 20–40 max | 72–1,024 |
| Shadow rays per pixel | 0–1 | 5 (1 global + 4 balls) |
| Steps per shadow ray | ~20 | 160 |
| Temporal reprojection | 8–16 frames | None |
| Effective ray budget multiplier | 1× (baseline) | ~50–100× |
Pure compute shader raymarching against SDFs — exactly what this benchmark does. Runs on any GPU without RT Cores.
This benchmark directly tests this code path.
Converts SDFs into simplified proxy geometry, builds BVH structures, uses RT Cores for intersection tests, validates with original SDF data.
Faster when available, but tests a different computational pathway.
06 — Performance
07 — Performance
Here's the reality: even an RTX 5090 cannot run this benchmark at high resolutions with all features enabled. This is by design. I wanted a benchmark that would remain usable for GPU generations to come while still having a "realistic" computational load.
The baseline configuration. An RTX 5090 handles this smoothly, never dropping below 24 FPS. Runs on any DirectX 12 hardware, though integrated graphics will struggle significantly — an ultraportable laptop might drop from 5 FPS to below 1 FPS as debris accumulates.
Tuned for 2025's fastest consumer GPU. Typically stays above 24 FPS, with occasional dips toward 15 FPS during intense moments. This is the recommended starting point for comparing high-end hardware.
For stress testing and future hardware. Even an RTX 5090 drops to 2–3 FPS at peak complexity. This shows what gaming could look like when hardware improves by 10×.
Why does debris matter so much? Each debris particle must be checked during every raymarching step, for every pixel, for every ray. With the default 80 debris: a single pixel might evaluate 72 primary steps × 80 particles = 5,760 distance calculations just for the primary ray. Add shadow rays and multiply by resolution. At Extreme (640 debris), this explodes to 46,080+ evaluations per pixel.
The benchmark's computational cost scales dramatically with configuration. Understanding these scaling factors helps interpret results correctly.
| Configuration | Pixels | Scene Evals/Pixel | Total Evals/Frame |
|---|---|---|---|
| 480p, Debris OFF | 0.3M | ~180 (primary + shadows) | ~54M |
| 480p, Default (80 debris) | 0.3M | ~390 × 80 loop iterations | ~9B |
| 480p, Extreme (640 debris) | 0.3M | ~390 × 640 loop iterations | ~75B |
| 4K, Debris OFF | 8.3M | ~180 | ~1.5B |
| 4K, Extreme (640 debris) | 8.3M | ~390 × 640 loop iterations | ~2.1T |
The debris loop is the dominant factor. Each additional particle adds distance calculations to every raymarching step. This creates a multiplicative relationship: going from 80 debris (default) to 640 debris (Extreme) increases per-pixel cost by 8×, regardless of resolution.
The baseline configuration. An RTX 5090 handles this comfortably, never dipping below 24 FPS even during peak complexity. Frame rate increases as bricks are destroyed. This configuration runs on any DirectX 12 hardware, though integrated graphics like an ultraportable's i5-1240P will drop from ~5 FPS to below 1 FPS as debris accumulates.
Tuned for the fastest consumer GPU of 2025. Typically maintains >24 FPS throughout gameplay, though occasional dips toward 15 FPS can occur during extreme activity spikes. This configuration provides meaningful benchmark discrimination while remaining playable. Ball glow lighting, soft shadows, and debris particles all contribute to compute load.
Stress test configuration that brings even an RTX 5090 into the 2–3 FPS range at peak complexity. This represents our vision for the future of gaming — when hardware delivers one order of magnitude improvement in compute throughput, this configuration becomes playable. Current flagships establish the baseline; future generations will close the gap.
Not compatible: This benchmark does not generate motion vectors, which DLSS and FSR require for temporal upscaling and frame generation. The raymarching approach calculates each frame independently from first principles — there's no temporal data to exploit. While Tensor Cores remain idle during execution, AI upscaling technologies cannot be applied to this workload.
The performance gap between "debris off" and "debris on" reveals something important about the future of graphics. With debris disabled, the benchmark shows what pixel-perfect rendering looks like — zero aliasing, physically accurate shadows, mathematical precision that triangle-based rendering cannot match. The visual quality is immediately distinguishable from traditional rendering.
With debris enabled, the benchmark shows what that quality costs. Current hardware cannot sustain it at high resolutions. But hardware improves. What requires 480p today will run at 4K eventually. The benchmark captures this trajectory.
07 — Running
08 — Running
radiance_dx12.exeResolution: 854×480 (480p)
Ray Steps: 72
Debris Particles: 80
Benchmark Duration: 1 run × 40 seconds (single) or 4 runs × 40 seconds (multi)
The four-run protocol executes:
Each run uses different random seeds, creating variation in ball trajectory and brick destruction order. This serves multiple purposes:
The benchmark employs several defenses against driver pattern recognition:
The 8×8 thread groups (64 threads) divide evenly by 16, 32, and 64 — ensuring full occupancy across:
08 — Scoring
09 — Scoring
The benchmark generates a single score that accounts for resolution, frame rate, and scene complexity. Higher scores indicate better performance.
The score reflects real-time computational throughput. Running at higher resolution lowers FPS but increases the resolution factor. Having more debris or balls on screen lowers FPS but increases complexity factors. The formula balances these tradeoffs so that scores remain comparable across different settings.
The benchmark tracks scene complexity throughout the run — how many bricks remain, how many debris particles are active, how many balls are in play. These real-time measurements feed into the final score, rewarding GPUs that maintain performance under load.
Outlier Handling: The benchmark automatically detects and removes FPS spikes using an asymmetric algorithm. High FPS spikes (including 2–4 frame bursts) are flagged as artifacts, while low FPS dips are only flagged if they're isolated single-frame spikes—sustained low FPS during heavy scenes is preserved as legitimate data. Outliers appear as large blue squares on the timeline chart, and the cleaned average FPS is used for scoring.
The benchmark score is calculated as:
Score = (√Resolution × FPS × DebrisFactor × BallFactor × BrickFactor) / 64
where:
Resolution = width × height
DebrisFactor = 1 + (AvgDebris / 320)
BallFactor = 1 + (AvgBalls - 1) / 4
BrickFactor = 1 + (AvgBricks / 80)
Square root of resolution: Prevents resolution from dominating the score. Doubling pixel count (4× threads) yields 2× resolution factor, not 4×. This keeps the emphasis on frame rate while acknowledging resolution cost.
Debris factor (/320): Gives modest credit for debris complexity. With 640 debris (max), this provides a 3× multiplier. Using /320 instead of /640 provides "extra credit" for debris since it's the primary compute driver — running with debris enabled is significantly harder than debris-off.
Ball and brick factors: Account for scene complexity variation during gameplay. More balls = more lighting calculations. More bricks = more SDF evaluations. These factors capture the real-time workload rather than just configured settings.
Divisor of 64: Normalizes scores to reasonable ranges. A flagship GPU at 480p/80-debris should produce scores in the 1000–2000 range.
The benchmark uses an asymmetric spike detection algorithm rather than IQR (interquartile range) outlier removal. This preserves legitimate performance variations while removing only true transient artifacts—with different handling for high spikes versus low dips.
Asymmetric Spike Detection:
Part 1 — Single-Sample Spikes (all directions):
A sample is flagged if BOTH conditions are met:
1. Extreme Value: Sample is in top 10% or bottom 10% of all FPS values
2. Spike Shape: Sample deviates >40% from neighbor average AND is higher/lower than both neighbors
Part 2 — Burst Detection (HIGH spikes only):
Consecutive samples (2–4) are flagged if ALL conditions are met:
1. All High Extreme: Every sample in the burst is in the top 10%
2. Context Deviation: Burst average deviates >50% from surrounding samples
3. Spike Shape: Burst average is higher than both context samples
Low dips are NOT flagged as bursts—sustained low FPS is often legitimate heavy GPU load, not an artifact.
This asymmetric approach correctly handles:
The report includes both raw and cleaned statistics:
The timeline chart displays outliers as large blue squares, making it immediately visible which samples were excluded. The scatter plot shows outliers as magenta X marks. Both charts include outlier indicators in tooltips.
The benchmark samples telemetry at 10 Hz (every 100ms), recording FPS, debris count, ball count, and brick count for each interval. The scoring formula is applied per sample, then scores are averaged (excluding outliers):
Per-Sample Scoring:
For each 100ms sample:
SampleScore = (√Resolution × FPS × DebrisFactor × BallFactor × BrickFactor) / 64
Final score = mean of all non-outlier sample scores
This per-sample approach means scores naturally weight periods of high complexity more heavily — a 10-second segment with 80 bricks contributes higher individual sample scores than a 10-second segment where most bricks are cleared. The final average reflects actual computational throughput across varying conditions.
The formula is designed to produce comparable scores across different settings, but perfect consistency is not achievable:
Important: Scores are not perfectly consistent across all resolution/debris combinations due to non-linear scaling effects. The primary value is comparing hardware at the same settings. Cross-configuration comparisons should be interpreted with appropriate caution.
Each benchmark generates a timestamped HTML report (e.g., benchmark_2025-12-10_121500.html) containing:
The charts provide user oversight of the outlier detection — you can visually verify which samples were flagged and whether the cleaned statistics accurately reflect sustained performance.
10 — Multiplatform
Radiance ships with three graphics API backends: DirectX 12 (Windows), Vulkan (Linux), and Metal (macOS). While the rendering output is visually identical across platforms, there are meaningful differences in benchmark behavior.
The most mature implementation. Outlier detection was developed and validated against DX12 frame timing behavior. Recommended for reviewers requiring maximum result consistency.
Status: Reference implementation
Linux and macOS systems appear more prone to frame time outliers. Whether this reflects driver behavior, compositor interaction, or hardware characteristics remains under investigation.
Status: Use judgment; re-run if outliers seem excessive
Cross-Platform Benchmarking: The outlier detection algorithm has been harmonized across all platforms, but Linux and macOS results may exhibit more variance. If you observe outlier counts significantly higher than expected (>10% of samples flagged), consider re-running the benchmark after closing background applications and ensuring the compositor isn't introducing latency.
The compute shaders are functionally identical across all three APIs, but each shading language has distinct syntax and conventions. The table below summarizes key differences:
| Feature | HLSL (DX12) | GLSL (Vulkan) | MSL (Metal) |
|---|---|---|---|
| Vector types | float2, float3, float4 |
vec2, vec3, vec4 |
float2, float3, float4 |
| Uniform buffers | cbuffer : register(b0) |
layout(std140, binding=0) uniform |
constant T& [[buffer(N)]] |
| Storage buffers | RWStructuredBuffer : register(u1) |
layout(std430, binding=N) buffer |
device T* [[buffer(N)]] |
| Output texture | RWTexture2D<float4> |
layout(rgba16f) image2D |
texture2d<float, access::write> |
| Thread ID | SV_DispatchThreadID |
gl_GlobalInvocationID |
[[thread_position_in_grid]] |
| Workgroup size | [numthreads(8, 8, 1)] |
layout(local_size_x=8, local_size_y=8) |
Set at dispatch time |
| Loop hints | [loop], [unroll] |
None (compiler decides) | None (compiler decides) |
| Output write | outputTex[id.xy] = val |
imageStore(tex, id, val) |
tex.write(val, id) |
| Float literals | 0.5 (implicit) |
0.5 (implicit) |
0.5f (explicit required) |
| Out parameters | out float x |
out float x |
thread float& x |
Despite syntactic differences, all three implementations share identical:
sdBox() using the standard Inigo Quilez formulationThe benchmark produces visually identical output across platforms. Performance differences reflect driver efficiency, GPU architecture, and API overhead — not algorithmic variation.
A deliberate design choice: the DirectX 12 and Vulkan implementations contain no vendor-specific optimizations. The shaders don't check for AMD, NVIDIA, or Intel hardware. They don't use vendor extensions. They don't tune workgroup sizes or unroll factors for specific architectures. This is intentional — the benchmark measures how well each GPU handles a uniform computational workload, not how well the benchmark author tuned code for a particular vendor's quirks.
Metal represents a different situation. Apple controls both the hardware (M-series silicon) and the graphics API, enabling optimizations that third-party GPU vendors cannot match on their own platforms. The Metal Shading Language compiles directly to Apple GPU microcode with intimate knowledge of the execution model. In benchmarking terms, this constitutes an architectural advantage — Apple's vertically integrated stack eliminates abstraction layers that AMD, NVIDIA, and Intel must traverse through DirectX or Vulkan.
Future Consideration: Vendor-optimized shader variants (leveraging AMD's wave intrinsics, NVIDIA's cooperative groups, or Intel's subgroup extensions) remain a possibility for future releases. Such variants would be distributed separately and clearly labeled, preserving the vendor-neutral baseline for cross-platform comparisons while enabling enthusiasts to extract maximum performance from specific hardware.
Source Availability: Complete shader source is included with all platform builds. The HLSL version serves as the reference implementation; the Vulkan and Metal ports maintain line-for-line algorithmic correspondence where language constraints permit.
09 — FAQ
11 — FAQ
Because we removed all the shortcuts. Normal games use pre-calculated lighting, simplified physics, and texture tricks. This benchmark calculates everything mathematically from scratch — every pixel, every frame. It's like the difference between driving to work and calculating your route using orbital mechanics.
Yes — debris is enabled by default with an 80-particle cap. This provides meaningful compute load without overwhelming most GPUs. The Extreme preset increases this to 640 particles (80 bricks × 8 debris per brick), which dramatically increases computational cost. Disabling debris makes the benchmark much easier but removes a significant portion of the workload.
Yes. This benchmark pushes sustained computational load. If your GPU is thermal throttling, the benchmark will show it — frame rates will drop during later runs. Ensure your cooling is adequate and your 12VHPWR cables are properly seated.
3DMark tests the traditional graphics pipeline — triangles, textures, rasterization. This benchmark tests pure compute shader performance through raymarching. They measure different capabilities. A GPU could score well on 3DMark but struggle here, or vice versa.
No. RT Cores accelerate triangle-ray intersection using specialized hardware. This benchmark uses mathematical equations (signed distance fields), not triangles. RT Cores sit completely idle during execution — they simply can't process this type of workload.
Unreal Engine 5's Lumen global illumination uses the same raymarching technique when RT Cores aren't available. Good performance here suggests good performance in UE5 games with software-based lighting. It's testing techniques that shipping games already use.
Each download shows a SHA256 checksum — a unique fingerprint for that file. You can verify your download matches by running this command in Windows PowerShell:
Get-FileHash .\Radiance-DirectX12.zip
Compare the "Hash" value to the SHA256 shown on this page. If they match exactly, your download is intact.
RT Cores implement the Möller–Trumbore algorithm for triangle-ray intersection. They're optimized for querying BVH acceleration structures with triangle meshes. Signed distance fields are mathematical functions — you cannot load length(p - center) - radius into an RT Core. The hardware has no mechanism to evaluate arbitrary functions; it only knows triangles.
Yes, and that's exactly what UE5 Lumen's hardware path does. But it would fundamentally change what the benchmark measures. You'd need to convert SDFs to meshes (preprocessing), build BVH structures (per-frame for moving debris), then validate hits against original SDFs (hybrid approach). For 640 moving particles requiring constant BVH rebuilds, the overhead may negate RT Core benefits. More importantly, we'd be testing triangle-ray intersection performance rather than compute shader efficiency.
64 threads divides evenly by 16, 32, and 64 — ensuring full SIMD utilization across NVIDIA (32-wide warps), AMD (64-wide wavefronts), and Intel Arc (variable widths). Larger groups could improve occupancy on some architectures but create partial wavefront utilization on others, artificially skewing results.
The physics kernel implements explicit Euler integration — the same fundamental algorithm in LS-DYNA, ABAQUS Explicit, and other finite element analysis codes used for automotive crash simulation and structural dynamics. The computational pattern (read state, apply forces, integrate, check contacts, write state) is structurally identical. Performance here provides a rough proxy for explicit dynamics simulations, though professional codes typically require FP64 double precision rather than FP32.
Computational biology tools that simulate protein folding use explicit integration with force field evaluation — similar to this benchmark's physics kernel. Each molecule's position updates based on electrostatic and van der Waals forces from neighbors. The memory access pattern (reading neighbor data, calculating forces, updating state) creates similar cache demands. Performance here provides a rough proxy for molecular dynamics without requiring domain expertise to configure a biological simulation.
Potentially. The physics kernel mixes integer operations (array indexing: debris[idx]) with floating-point (physics calculations: p.vel.y -= 0.015). Intel Arc's architecture can execute integer and float operations from the same thread in a single cycle. This specific workload might let that feature shine, though we haven't verified it empirically.
Adjacent pixels can take wildly different execution paths — one hitting after 5 steps, another marching 150 steps. These threads share a SIMD group. NVIDIA handles this through warp-level predication; AMD's wider wavefronts may see more divergence impact. Intel's variable SIMD width provides flexibility. Architectures with better divergence handling show measurable advantages.
Workload characteristics: FP32 compute-focused, not representative of current game workloads. Specific to raymarching techniques, not path tracing or photon mapping. Physics simulation is simplified compared to professional FEA codes.
Platform coverage: DirectX 12 (Windows), Vulkan (Linux), and Metal (macOS). WebGPU version exists but lacks automated benchmark features.
Does not test: Memory bandwidth to VRAM (small working set stays cache-resident), RT Core performance, Tensor Core performance, traditional rasterization pipeline.
Verifying checksums ensures your download wasn't corrupted or tampered with. Compare the output of these commands against the SHA256 hash shown below each download link.
Windows (PowerShell):
Get-FileHash .\Radiance-DirectX12.zip -Algorithm SHA256 | Select-Object -ExpandProperty Hash
Linux:
sha256sum Radiance-Vulkan-Linux_x86-64.AppImage
macOS:
shasum -a 256 Radiance-macOS.dmg
The output should exactly match the 64-character hex string shown in the download section. If they don't match, delete the file and download again.
10 — The Future
12 — The Future
In 1981, 640K of system memory was thought to be plenty. More than forty years later, that number is a punchline. Today's smartphones carry more memory than entire data centers of that era.
Thinking that 2025 GPU hardware is "good enough" repeats the same mistake.
This benchmark exists because a simple paddle-and-ball game — 80 bricks, rendered with mathematical precision — can bring a flagship GPU to its knees. Not because the hardware is weak. The RTX 5090 is a marvel of engineering, containing billions of transistors executing trillions of operations per second. It's extraordinarily powerful by any historical measure.
It's just not powerful enough.
The visual quality you see in Radiance at 480p — the perfect anti-aliasing, the soft penumbral shadows, the mathematically precise surfaces — is what all games could look like. Not as a stylized choice, but as a technical baseline. Zero shimmering. Zero jagged edges. Zero texture filtering artifacts. Every pixel calculated from first principles.
We're not there yet. But we will be.
Developers today make thousands of compromises. Baked lighting instead of real-time global illumination. Triangle meshes instead of mathematical surfaces. Temporal reprojection to amortize costs across frames. Screen-space approximations. Level-of-detail hacks. These aren't artistic choices — they're engineering necessities, workarounds for hardware that can't yet deliver the uncompromised vision.
Every generation, some of those compromises become unnecessary. What required tricks in 2015 runs natively in 2025. The techniques that seem impossibly expensive today will be baseline expectations in 2035.
We call them "GPUs" by legacy — Graphics Processing Units — but that name is historical artifact. These are massively parallel math processors. They train neural networks, simulate protein folding, mine cryptocurrencies, render films, and occasionally play games. The "graphics" in GPU describes their origin, not their destiny.
The same silicon that struggles with this benchmark today will run real-time path tracing tomorrow. Then real-time fluid dynamics. Then simulations we haven't imagined yet. The trajectory is clear; the timeline is not.
This benchmark captures a moment in that trajectory. It shows what we're reaching toward — and measures how far we have to go. The gap between "playable with compromises" and "playable without compromises" is the opportunity space for the next generation of hardware.
Tim Sweeney saw this future in 1999. The industry has spent twenty-five years building toward it. We're not at the finish line — we're at the starting blocks of something much bigger. The next twenty-five years will be extraordinary.
Reference